
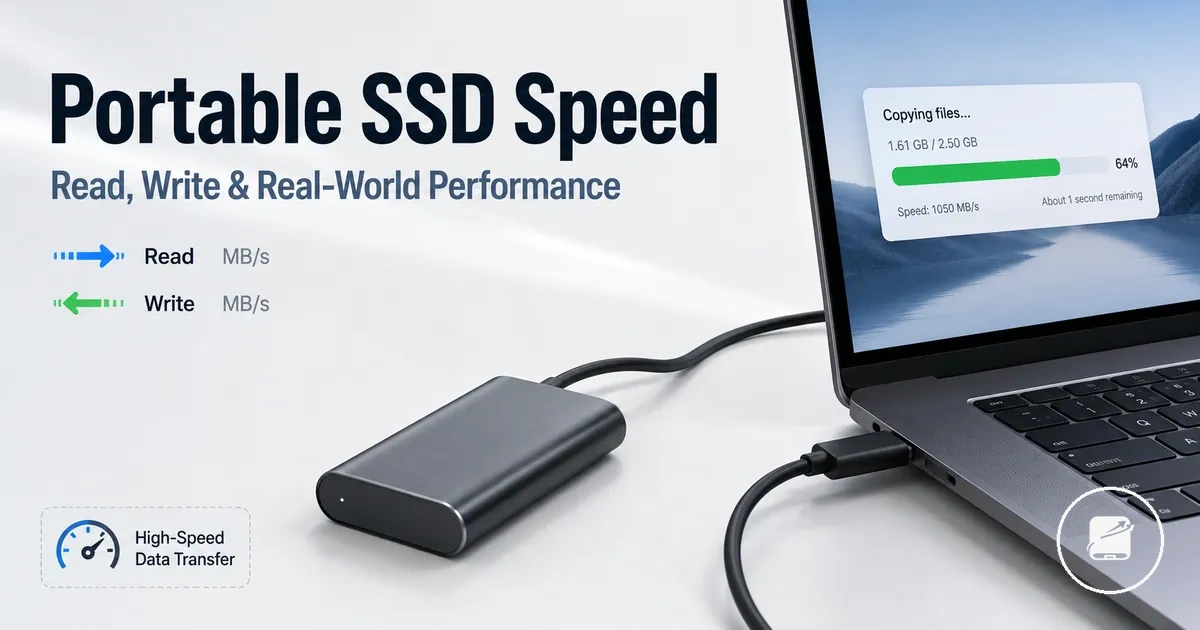
Portable SSD speed and real-world performance
Portable SSD speed is the transfer performance produced by the drive, interface, host device, workload and operating temperature as a complete system. Advertised read and write speeds are tested maximums, while real-world performance is the lower rate maintained under the actual connection and transfer conditions.
Portable SSD speed is the transfer performance produced by the drive, interface, host device, workload and operating temperature as a complete system.
Portable SSDs use solid-state storage through an external connection, so practical throughput cannot exceed the slowest supported component in the path: the drive, cable, port or host controller. USB Implementers Forum identifies USB 3.2 Gen 1, Gen 2 and Gen 2x2 signalling rates as 5 Gbps, 10 Gbps and 20 Gbps respectively, and states that connected products operate at their lowest common speed capability.
A drive connected through USB 3.2 Gen 1 is therefore limited to the 5 Gbps connection category even when the drive and cable support 10 Gbps.
The interface rate is a signalling ceiling rather than a guaranteed file-transfer result because protocol overhead, storage-controller processing and file-system activity use part of the available bandwidth. A drive connected through USB 3.2 Gen 1 is therefore limited to the 5 Gbps connection category even when the drive and cable support 10 Gbps.
Workload changes transfer behaviour because large sequential files require fewer file-system operations than folders containing many small files. Sequential transfers are more likely to approach a drive's stated test conditions, while small-file workloads produce lower throughput because each file adds command and metadata processing.
The small-file transfer usually records the lower rate because the host and drive must process more individual operations.
For example, copying one large video file and copying a folder containing thousands of small documents can move the same total amount of data but produce different average speeds. The small-file transfer usually records the lower rate because the host and drive must process more individual operations.
Burst write speed and sustained write speed are separate performance states.
Burst write speed and sustained write speed are separate performance states. A portable SSD can use a high-speed cache for an initial transfer and then continue at a lower sustained rate after that cache is filled, so sustained-write testing is more relevant than a peak specification for repeated large-file transfers.
Heat introduces another conditional limit during prolonged activity.
Heat introduces another conditional limit during prolonged activity. Samsung states that its Dynamic Thermal Guard is designed to reduce performance loss caused by overheating, which confirms that thermal management can affect sustained transfer speed; the trigger temperature and resulting rate remain model-specific values that must be checked in the relevant product documentation.
Product support should therefore be based on the documented interface, capacity-specific specification, host requirements and sustained-workload evidence rather than a single headline figure.
Product support should therefore be based on the documented interface, capacity-specific specification, host requirements and sustained-workload evidence rather than a single headline figure. SanDisk specifies up to 1,050 MB/s sequential read speed and 1,000 MB/s sequential write speed for the documented Extreme Portable SSD configuration, while noting that host device, interface and usage conditions can reduce actual performance; these values apply to that configuration rather than to portable SSDs as a class.
A practical speed estimate starts with the lowest supported interface category and then accounts for workload and heat.
A practical speed estimate starts with the lowest supported interface category and then accounts for workload and heat. A short sequential transfer through a correctly matched connection is more likely to approach the stated maximum, while a long mixed-file transfer through a slower host port produces a lower practical rate.
Table of Contents
What portable SSD speed means
Portable SSD speed is the transfer rate at which data can be read from or written to the drive under a specified workload and connection condition. Read speed measures data leaving the drive, while write speed measures data being stored under those stated read and write conditions.
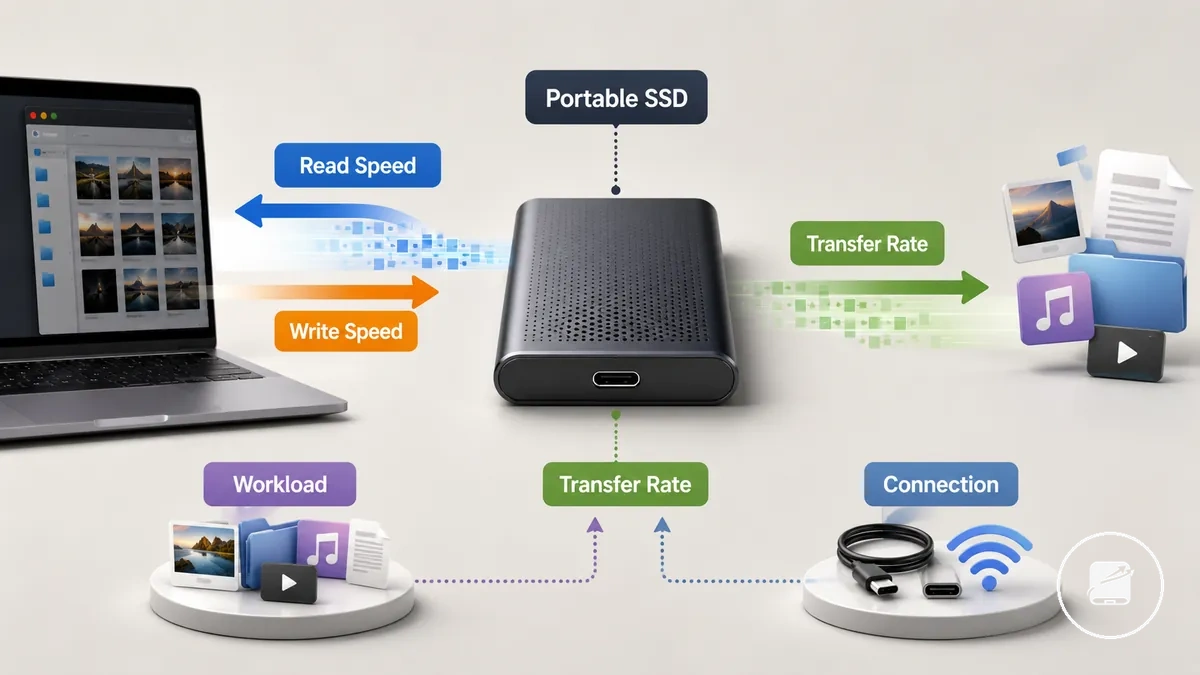
A portable SSD speed rating usually expresses throughput in megabytes per second, written as MB/s, while an interface rating expresses signalling capacity in gigabits per second, written as Gb/s. OWC reports that a USB 3.2 Gen 2 connection rated at 10 Gb/s produces about 900–1,000 MB/s in its documented real-world portable SSD examples. Advertised speed is therefore a ceiling-like signal measured under stated conditions, whereas real transfer speed reflects the active workload, drive behaviour and connection condition.
The expected performance range must be interpreted within the stated test conditions rather than as a fixed result for every file transfer.
For example, transferring one large sequential file can remain closer to the rated read speed or write speed than transferring many small files because the smaller-file workload requires more individual operations. The expected performance range must be interpreted within the stated test conditions rather than as a fixed result for every file transfer.
Speed ratings, transfer rates, and usable throughput
Speed rating, transfer rate, and usable throughput describe different attributes of portable SSD performance. A speed rating identifies the advertised performance measured under a defined test condition, while usable throughput represents the effective data movement achieved during real file transfers. This distinction separates the published rating from practical transfer performance.
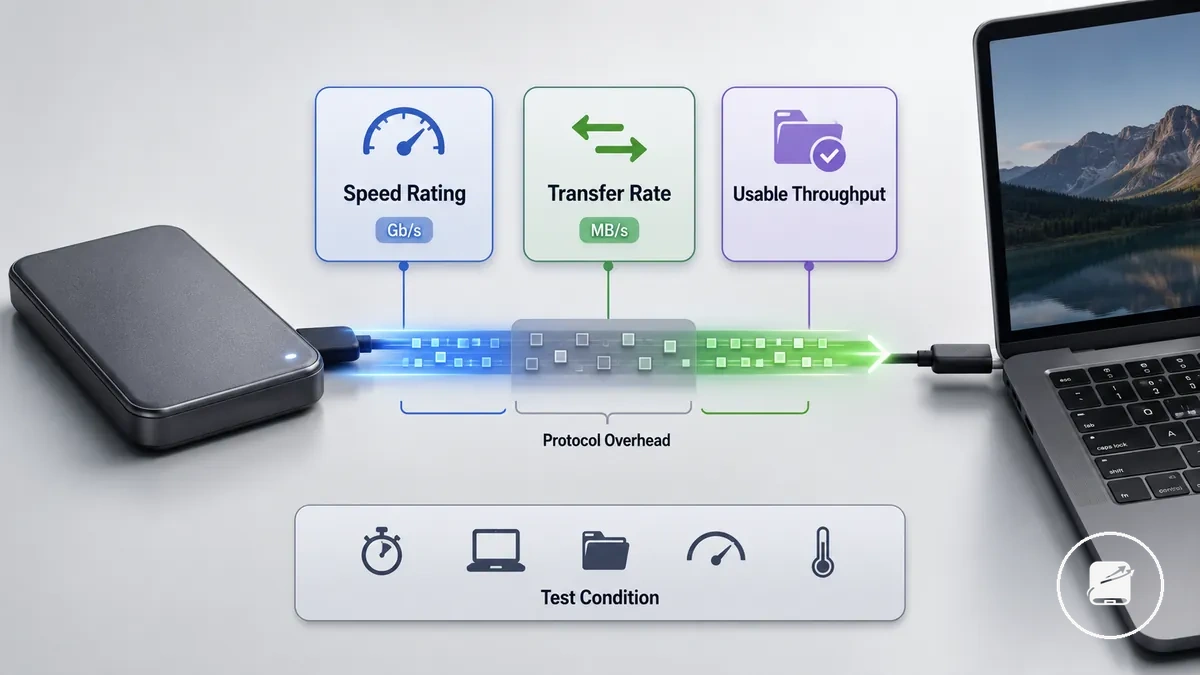
Transfer rate is commonly expressed in MB/s, whereas interface signalling is often expressed in Gb/s, so the units describe different parts of the data path rather than interchangeable values. According to the USB Implementers Forum, protocol overhead reserves part of the available signalling bandwidth for communication tasks, reducing the usable throughput available for real file movement. For example, a USB connection with a higher signalling rate can still deliver lower effective file-copy performance when protocol overhead and the selected test condition are taken into account.
Term comparison:
| Term | What it describes | Why it may differ in real use |
|---|---|---|
| Speed rating | Advertised performance measured under a defined test condition | Represents controlled testing rather than everyday file transfers |
| Transfer rate | Data transfer expressed in MB/s or interface signalling expressed in Gb/s | Different units describe different attributes and should not be treated as direct equivalents |
| Usable throughput | Effective speed during real file movement | Protocol overhead, connection mode and workload reduce practical throughput below the advertised rating under many operating conditions |
Read, write, and transfer speed differences
Portable SSD performance is evaluated through read speed, write speed, and transfer speed, each measuring a different aspect of data movement. Read speed reflects how quickly data is retrieved, write speed measures how quickly data is stored, and transfer speed describes the practical outcome of moving files between devices. These three dimensions should be considered together rather than as a single performance figure.
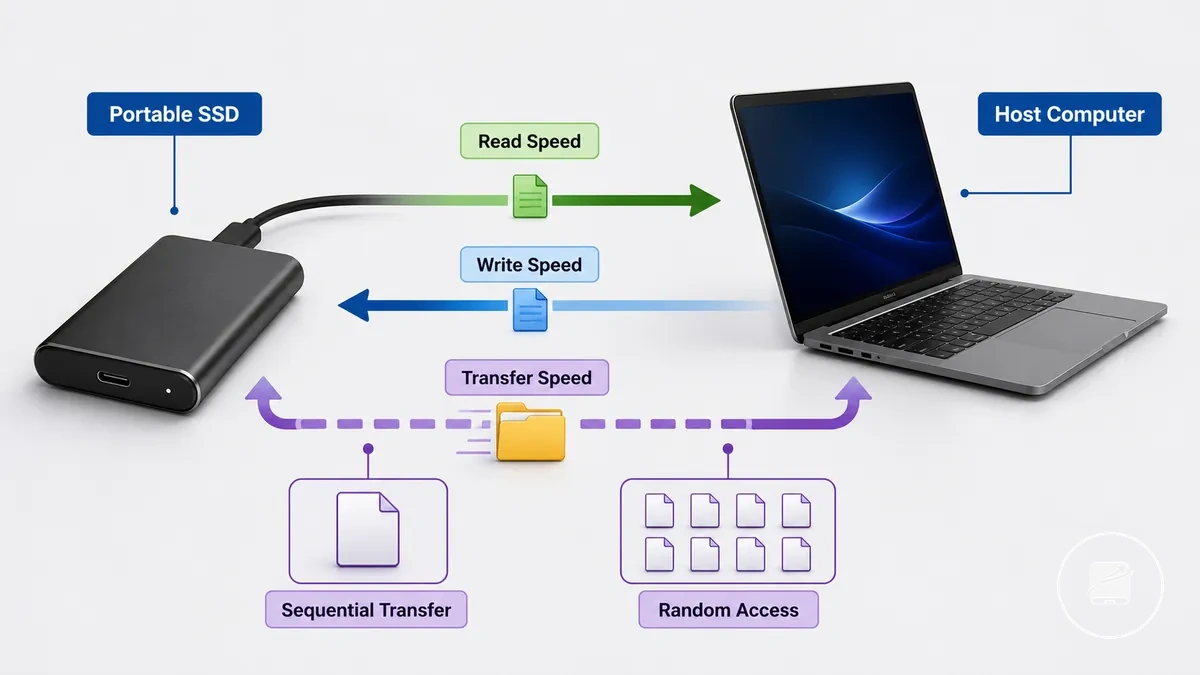
Read speed affects opening files, loading applications, and reading data from the source drive. Write speed affects saving files and copying files to the portable SSD. According to manufacturer documentation from ADATA and similar SSD vendors, sustained write performance can be lower than peak read performance because continuous writing places a different workload on the storage device. A portable SSD can therefore deliver fast read speed while recording lower sustained write speed during extended copy operations.
Write speed affects saving files and copying files to the portable SSD.
Transfer speed represents the practical result of a file-copy workload rather than a single benchmark value. It reflects the combined effect of sequential transfer, random access, and the performance of both the source and destination devices. For example, copying a single large video file mainly uses sequential transfer, while copying thousands of small files increases random access activity and changes practical transfer behaviour. The comparison below highlights how each speed dimension answers a different performance question.
| Speed type | What it measures | Practical effect | Main limitation |
|---|---|---|---|
| Read speed | Reading data from the portable SSD | Improves opening files and loading data from the source drive | Does not indicate how quickly data can be written to the drive |
| Write speed | Writing data to the portable SSD | Improves saving files and copying files to the drive | Sustained write speed can be lower than peak write measurements during long write workloads |
| Transfer speed | Overall file movement between the source and destination devices | Represents practical performance during copying or moving files | Changes with sequential transfer, random access, file-copy workload, and the performance of both connected devices |
Sequential speed and file-copy performance
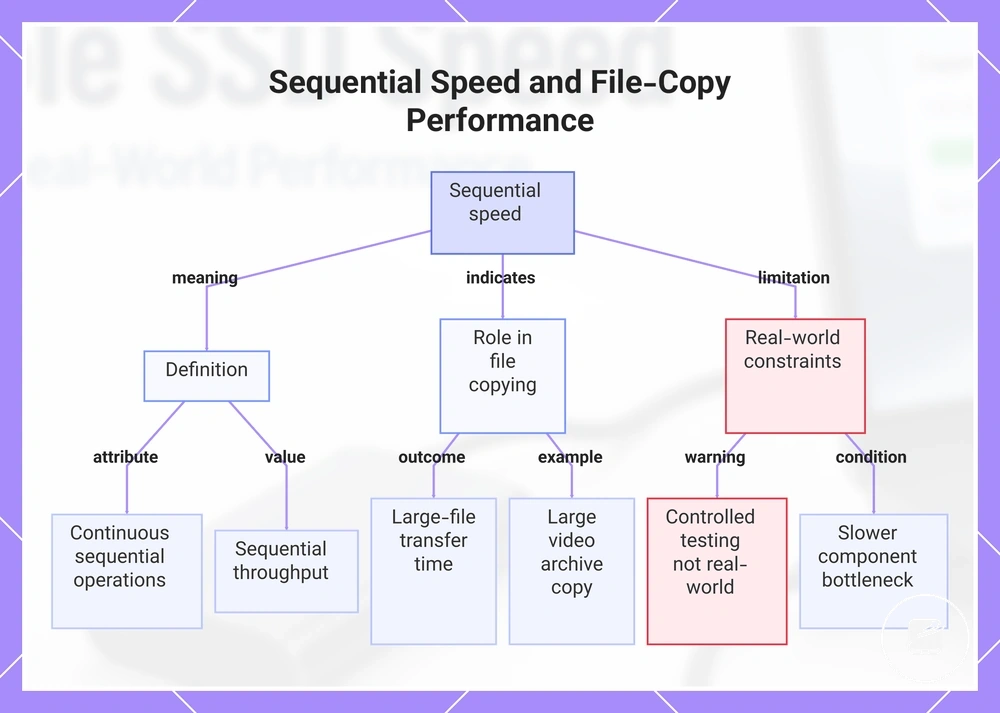
Sequential speed is the performance metric that measures how quickly a portable SSD performs continuous sequential read or sequential write operations. It is the attribute most closely associated with large-file copying because data is transferred in a continuous stream rather than through scattered storage locations. This makes sequential speed the primary indicator of the transfer-time outcome for large-file movement under sequential workloads.
This makes sequential speed the primary indicator of the transfer-time outcome for large-file movement under sequential workloads.
For example, copying a single large video archive is a workload where sequential speed provides a practical indication of expected file-copy performance. According to the reviewed evidence, benchmarked sequential throughput reflects controlled continuous-transfer testing rather than every real-world copy operation, so observed results remain conditional. The effective transfer-time outcome is also constrained by the performance of both the source drive and the destination path, because the slower component determines the transfer bottleneck.
This chart explains what sequential speed is, how it indicates large-file copy performance, and what real-world constraints affect the outcome.
This chart explains what sequential speed is, how it indicates large-file copy performance, and what real-world constraints affect the outcome.
Large files, small files, and mixed transfers
The same portable SSD can show different apparent performance across transfer jobs even when the drive is unchanged. The main variable is file composition, including file size, file count, and the arrangement of files within folders.
The same portable SSD can show different apparent performance across transfer jobs even when the drive is unchanged.
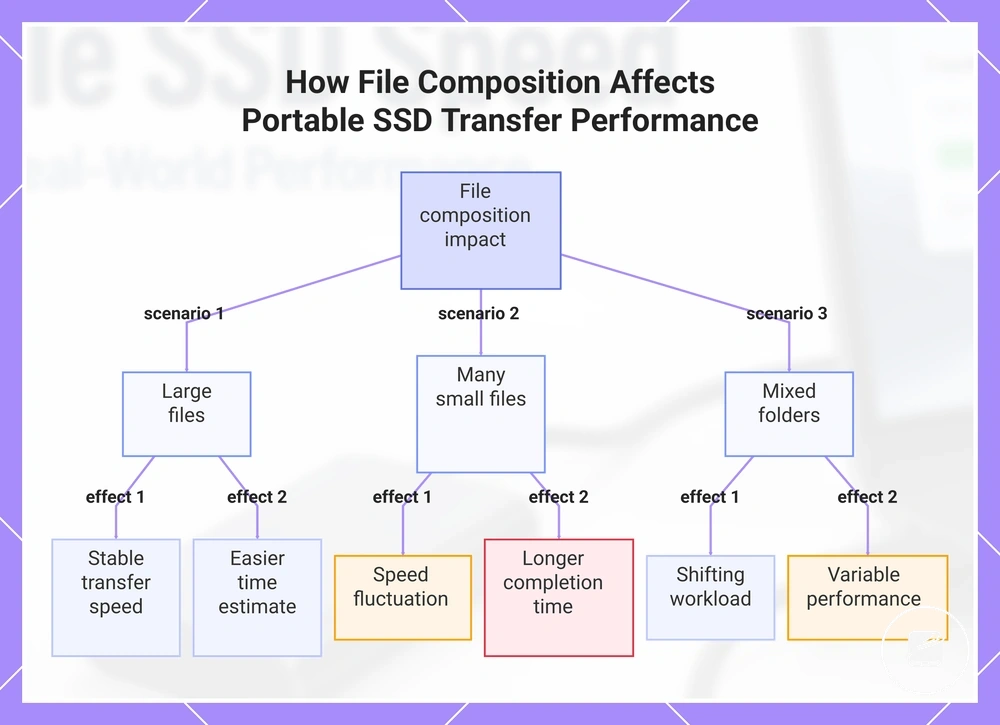
Mixed transfers combine large files, small files, and nested folders, so practical performance can shift during the same copy operation. A higher file count increases metadata overhead because the system must process more individual file and folder entries, while a more complex folder structure adds further file-system work. These workload changes can produce speed fluctuation and extend completion time compared with a transfer job dominated by fewer, larger files. The practical expectation is that the visible transfer rate will reflect the current file mix rather than one constant result.
The practical expectation is that the visible transfer rate will reflect the current file mix rather than one constant result.
File size and file count can change transfer behaviour even when the drive is unchanged:
- Large files: A transfer job containing a few large files involves fewer individual file operations, so the displayed speed is more likely to remain stable and the completion time is easier to estimate under the same transfer path.
- Many small files: A transfer job containing many small files requires more per-file processing and metadata handling, so speed fluctuation can increase and completion time can become longer.
- Mixed folders: A mixed folder copy combines changing file sizes, file counts, and folder depths, so the workload shifts during the transfer and practical performance can rise or fall as each pattern is processed.
This chart shows how different file compositions—large files, many small files, and mixed folders—influence transfer speed and completion time on a portable SSD.
USB-C, USB 3.2, USB4, and Thunderbolt speed limits
A portable SSD reaches its intended speed only when the drive, cable, and host port support the same connection capability. USB-C identifies the connector shape, while USB 3.2, USB4, and Thunderbolt identify the protocol that sets the possible throughput ceiling.
| Connection label | What it can indicate | Speed relevance | What still needs to match |
|---|---|---|---|
| USB-C | Connector shape | Does not define a speed limit by itself | Protocol, cable, and host port |
| USB 3.2 | USB data-transfer generation | Sets a USB 3.2 interface ceiling for the supported generation | Portable SSD, cable, and host port must support that generation |
| USB4 | USB4 data protocol | Provides a higher possible throughput ceiling than a lower USB 3.2 connection when the full path supports USB4 | USB4-capable portable SSD, cable, and host port |
| Thunderbolt | Thunderbolt data protocol | Provides its stated interface ceiling only across a complete Thunderbolt connection | Thunderbolt-capable portable SSD, cable, and host port |
The connection layer acts as a speed limit because the transfer operates at the highest capability shared by every component in the path. For example, a USB4 portable SSD connected to a USB 3.2 host port is limited to the supported USB 3.2 connection rather than the drive's higher interface capability. A faster host port also cannot raise throughput beyond the protocol supported by the portable SSD and cable. The practical ceiling is therefore qualified by the lowest supported link, including the host port.
The practical ceiling is therefore qualified by the lowest supported link, including the host port.
Check the labels or specifications for both the cable and host port because identical USB-C connectors can carry different protocols and speed limits. This is a speed-compatibility boundary only; broader device support and feature matching are covered under ports and cable limits.
Ports, cables, and host device limits
A portable SSD can approach its rated speed only when the port, cable, host device, host controller, and drive interface support the same transfer capability. The slowest compatible part sets the practical ceiling.
The slowest compatible part sets the practical ceiling .
The connection chain works in order from the host port through the cable and host controller to the drive interface. If one link supports a lower transfer mode than the others, that link becomes the speed cap and can create a transfer bottleneck. For example, a portable SSD with a faster drive interface will still operate at the lower mode supported by the cable or host port. This check remains local to connection speed and does not establish the cause of every slow transfer.
This check remains local to connection speed and does not establish the cause of every slow transfer.
Use this mini-checklist to qualify each link in the speed chain:
- Port: Verify that the port mode supports the transfer capability required for the portable SSD's rated speed.
- Cable: Confirm that the cable mode matches the supported port mode and drive interface; a lower cable mode imposes a lower practical ceiling.
- Host controller: Check that the host controller supports the intended transfer mode; a lower host limit becomes the speed cap.
- Drive interface: Confirm that the drive interface supports the same or a lower mode than the rest of the connection chain, because it cannot exceed its own interface ceiling.
- Source and destination path: Treat the connection chain as only one condition; a slower source or destination can remain the transfer bottleneck even when the port, cable, host controller, and drive interface match.
NVMe portable SSDs and external enclosure limits
Myth: An NVMe portable SSD automatically delivers internal-drive performance. Truth: NVMe identifies the drive technology, while the external speed outcome is also limited by the external enclosure, its enclosure bridge, the external interface, and host support. NVMe capability and externally observed speed therefore remain separate performance considerations.
Myth: An NVMe portable SSD automatically delivers internal-drive performance.
The enclosure bridge connects the NVMe drive to the external connection, and the USB interface or Thunderbolt interface defines the maximum throughput available outside the enclosure. Thermal design also influences sustained speed because prolonged transfers can reduce performance if heat cannot be managed effectively. For example, an NVMe drive with higher internal capability will still operate within the throughput provided by the external interface and enclosure, even before host support is considered. The final external speed outcome remains qualified by both the enclosure design and the capabilities of the connected host.
The final external speed outcome remains qualified by both the enclosure design and the capabilities of the connected host.
Check these factors when comparing internal NVMe capability with external performance:
- Enclosure bridge: Confirm that the bridge chip supports the intended transfer mode between the NVMe drive and the external connection.
- External interface: The USB interface or Thunderbolt interface establishes the maximum external throughput available to the portable SSD.
- Thermal design: Effective cooling helps maintain sustained speed, while host support determines whether the available interface capability can be fully used.
Real-world portable SSD performance
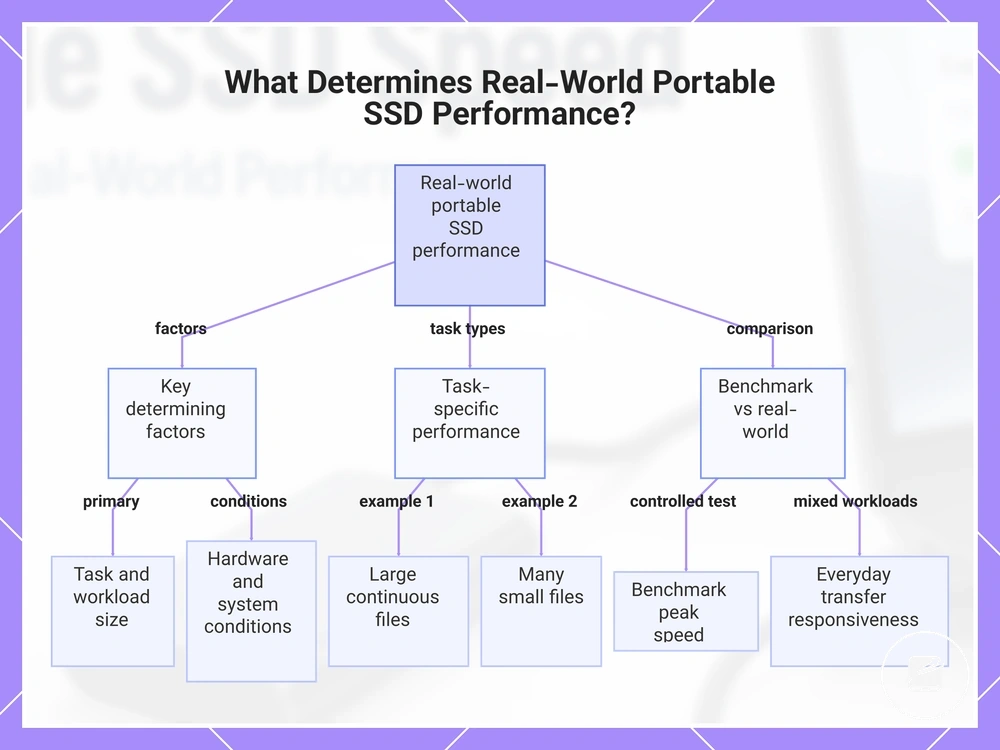
During normal use, real-world portable SSD performance is determined by the task and its workload size, not by a benchmark result alone. Copying a few documents, moving one large media file, and opening an active project folder create different transfer patterns. Normal use should therefore be judged against the workload being processed.
These combined conditions determine perceived performance .
The source drive, destination drive, connection path, and current system activity set the practical speed limit for each task. A slower source or destination reduces transfer speed below the portable SSD's own capability, while background processes can lower responsiveness by competing for storage and processor resources. For example, a folder containing many small files can feel slower to copy than one large file because each item requires separate file-system operations. These combined conditions determine perceived performance.
The source drive , destination drive , connection path , and current system activity set the practical speed limit for each task.
Real-world portable SSD performance changes by task:
- File transfer: One large continuous file usually produces steadier transfer behaviour than a folder containing many small files.
- Media library: Browsing and moving large media files feels faster when both the source drive and destination drive can sustain the same transfer rate.
- Active project folder: Saving and synchronising frequently changing files can feel less responsive when background processes are using the same storage resources.
- Game library or general external storage: Loading and copying remain limited by the connection path and the slower device in the transfer.
Benchmark peak speed represents performance under controlled test conditions, whereas everyday transfer responsiveness reflects mixed workloads and active system conditions. A portable SSD can therefore operate normally while its user-visible speed remains below the published benchmark peak.
A portable SSD can therefore operate normally while its user-visible speed remains below the published benchmark peak.
This chart shows the key factors that determine real-world portable SSD performance, how it varies by task type, and how it differs from benchmark peak speeds.
Peak speed versus typical transfer speed
Peak speed is the highest transfer rate measured under a defined test condition, while typical transfer speed reflects the performance most users observe during an everyday transfer. An advertised peak represents performance under controlled conditions rather than every practical workload. The distinction between peak and typical transfer speed therefore reflects different operating conditions rather than conflicting measurements.
An advertised peak represents performance under controlled conditions rather than every practical workload.
Typical workload conditions include different file sizes, storage devices, connection paths, and background system activity, all of which influence observed speed. Test duration also affects results because short benchmark runs and sustained transfers place different demands on storage performance. For example, copying one large file can produce a different observed speed than transferring thousands of small files on the same portable SSD because file-management overhead increases. Any performance gap should therefore be interpreted in relation to the workload and test conditions rather than as a fixed or guaranteed difference.
Test duration also affects results because short benchmark runs and sustained transfers place different demands on storage performance.
The comparison below highlights how the two measurements differ:
| Peak speed | Typical transfer speed |
|---|---|
| Measured under a controlled test condition. | Observed during an everyday transfer using a typical workload. |
| Usually reflects a narrow, repeatable workload designed to measure maximum capability. | Reflects mixed file sizes, storage devices, connection paths, and background activity. |
| Often based on shorter benchmark durations. | Represents sustained transfers where workload characteristics influence observed speed. |
| Useful for comparing the maximum rating of different devices. | Useful for estimating practical performance during ordinary work. |
Sustained write speed during longer transfers
Sustained write speed is a portable SSD's ability to keep writing data during longer transfers after the initial fast phase. A drive may write faster while its write cache is available, then continue at a maintained or reduced write speed after that cache is filled. This separates short initial performance from sustained writing.
This separates short initial performance from sustained writing.
After the initial fast phase, controller behaviour determines how efficiently cached data is transferred to NAND memory. The available cache, the current NAND condition, and the workload determine whether the drive maintains its write rate or enters a slower sustained phase. For example, copying a large video archive is more likely to exhaust the write cache than transferring a small document folder. The transition is conditional on the drive and workload rather than occurring at one universal transfer duration.
The comparison below shows how write behaviour changes after the initial fast phase.
The comparison below shows how write behaviour changes after the initial fast phase.
| Write phase | What is happening | Why speed may change | Interpretation |
|---|---|---|---|
| Burst write | The drive writes at its highest short-term rate. | Available cache and favourable operating conditions support maximum throughput. | Represents brief write performance rather than sustained transfer behaviour. |
| Cache-assisted write | The write cache continues receiving incoming data. | Available cache decreases as the transfer continues. | Speed remains elevated while sufficient cache capacity is available. |
| Sustained write | The controller writes data according to the drive's native NAND and thermal conditions. | Cache exhaustion, NAND condition, workload, and heat can reduce the maintained write rate. | Best represents performance during extended transfers. |
Heat during prolonged activity can contribute to reduced write speed, but sustained write results also differ by model, capacity, fill level, workload, and temperature. These conditions define the practical boundary for comparing drives or test results. Related temperature behaviour is covered under portable SSD heat.
Cache behaviour and write speed drops
Cache behaviour explains why some portable SSDs start quickly and then show write speed drops during extended writes. The drive uses the fast-cache period to absorb incoming data at a higher rate, and the write rate can decrease once the available cache size has been consumed. Cache exhaustion is therefore one possible cause of the transition from the fast phase to a slower sustained phase.
Cache exhaustion is therefore one possible cause of the transition from the fast phase to a slower sustained phase.
For example, copying a large video library that continues beyond the fast-cache period can begin at a high speed and then slow as the drive writes directly according to its current drive state, producing a longer completion time. This pattern does not by itself indicate a fault because the slowdown occurs under a defined condition: the transfer outlasts the cache-assisted phase. Controller behaviour, NAND condition, workload, and temperature can also contribute to the slowdown, so cache behaviour should be treated as one qualified explanation rather than the cause of every write-speed drop.
Why portable SSD speed varies
Portable SSD speed varies when the connection, workload, drive state, system load, or heat becomes the active throughput limit. The affected attribute may be read speed, write speed, or sustained transfer speed, producing a brief fluctuation or a longer transfer slowdown. This performance variation usually reflects interacting limits rather than one universal cause.
This performance variation usually reflects interacting limits rather than one universal cause.
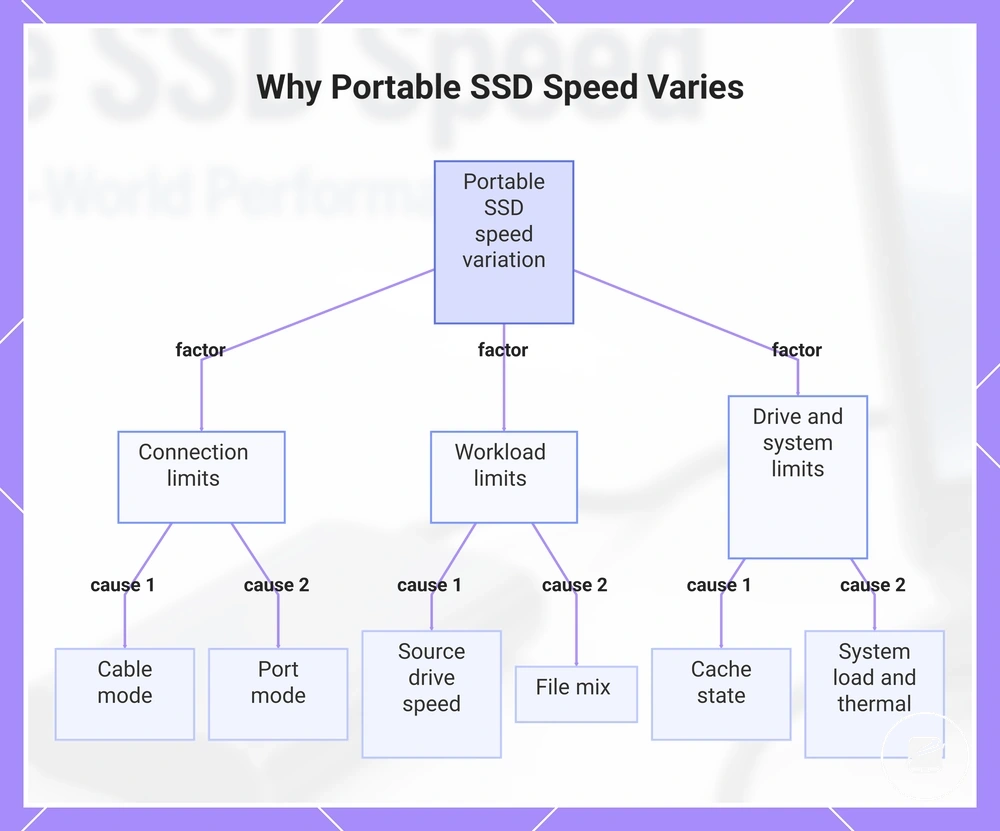
Portable SSD speed varies because multiple conditions can limit throughput at different stages of a transfer. The diagnostic points below connect each condition to the affected speed attribute and the likely symptom or outcome.
- Cable mode: A cable operating in a lower data mode reduces connection bandwidth, so read and write speed remain below the portable SSD's higher supported rate.
- Port mode: A slower USB or Thunderbolt mode imposes a lower speed limit, producing a consistent ceiling across repeated transfers.
- Source drive speed: A slower source supplies data below the portable SSD's available write rate, so the destination waits and the transfer takes longer.
- File mix: Large sequential files support steadier throughput, while many small files increase per-file processing and produce lower or less consistent transfer speed.
- Free space and drive state: Low free space can increase internal data management, reducing sustained write speed during longer workloads.
- Cache: Available cache supports a faster initial write phase; once that cache is consumed, sustained write speed can decrease and extend completion time.
- System load and thermal behaviour: Competing processor, storage, or background activity can interrupt data flow, while thermal behaviour under sustained heat can reduce maintained transfer speed.
Short changes between faster and slower rates can be normal when the file mix, cache state, or system activity changes during one transfer. A persistent slowdown is more likely when the same reduced rate continues across different files, ports, cables, and operating conditions rather than appearing only during one workload phase. Repeated behaviour of that kind belongs in a focused review of slow portable SSD transfer speed.
Repeated behaviour of that kind belongs in a focused review of slow portable SSD transfer speed .
This chart shows the main conditions that cause portable SSD speed to vary, grouped by connection, workload, and drive/system limits.
File size, drive state, and system activity
Portable SSD transfer speed changes when file size, drive state, or system activity changes the workload presented to the storage system. Large sequential files usually maintain steadier throughput than workloads containing many small files, while limited free space or competing activity can contribute to throughput reduction. These conditions explain speed fluctuation without changing the SSD model.
These conditions explain speed fluctuation without changing the SSD model.
Speed is partly shaped by what is being moved and what the system is doing during the transfer. The observations below help identify a workload condition or transfer-path bottleneck, but each indicates a possible influence rather than a guaranteed cause.
- File size: Observe whether large files transfer more steadily than small files; smaller files often involve more file-management operations that reduce effective throughput.
- File count: Observe whether thousands of small files finish more slowly than one file of similar total size; a higher file count increases processing between individual transfers.
- Free space and drive state: Observe whether performance becomes less consistent as available free space decreases; a fuller drive state can require more internal data management during writes.
- Background processes: Observe whether backup, indexing, antivirus scanning, or other background processes are active; increased system activity can interrupt data flow and reduce perceived transfer speed.
- Source drive speed and destination path: Observe whether the source drive speed or destination path is slower than the portable SSD; the slowest stage in the transfer path becomes the effective throughput limit.
When faster portable SSD speed matters
Faster portable SSD speed matters most when the workload repeatedly moves enough data for shorter transfer times to create practical value. Higher speed offers limited benefit when transfers are small, infrequent, or constrained elsewhere. Speed matters when the workload can use the extra throughput.
Speed matters when the workload can use the extra throughput .
Start with the use case rather than treating the highest available speed as the default choice. A demanding speed requirement is more likely when the work involves large files, repeated transfers, or both, while occasional document backups place less pressure on completion time. The main workload criteria are therefore file size and transfer frequency.
| Use case | Speed need | What limits the benefit | Decision signal |
|---|---|---|---|
| Occasional document or photo backup | Moderate speed is usually sufficient | Small transfer size and low transfer frequency | A faster drive offers limited time savings |
| Large media transfers | Higher sustained transfer speed has practical value | Source-drive speed, file mix, and host connection | Large files are moved often and completion time matters |
| Active project work | Higher read and write speed can improve responsiveness | Application behaviour and host-port support | Project files are opened, saved, or moved directly on the portable SSD |
| High-volume copying | Higher sustained write speed is valuable | Source throughput and the slower stage of the transfer path | Repeated batches make cumulative waiting time significant |
Host-port support determines whether a faster drive can deliver its intended benefit because the connection must provide enough bandwidth for the drive's transfer rate. A drive connected through a lower-bandwidth port is limited by that port even when the SSD supports a higher rate. Time sensitivity increases the actual benefit because saving time on frequent production transfers has greater value than shortening an occasional copy.
A drive connected through a lower-bandwidth port is limited by that port even when the SSD supports a higher rate.
For example, large media transfers benefit from higher sustained speed when footage or image libraries are copied regularly, while active project work benefits when files are read from and written to the portable SSD throughout a session. Readers who need storage for direct media workflows can compare the relevant criteria for portable SSDs for video editing. High-volume copying also creates a clear decision signal because small time savings accumulate across repeated batches.
High-volume copying also creates a clear decision signal because small time savings accumulate across repeated batches.
Choose a faster drive when the use case combines large files, frequent transfers, compatible host-port support, and meaningful time pressure. Choose according to the practical need when one or more of those conditions is absent, because unused speed capability adds little performance value. The appropriate choice is the drive whose usable throughput matches the workload rather than the model with the highest specification alone.
The products below are useful examples for comparing available options.
The products below are useful examples for comparing available options. Before buying, check that the compatibility criteria, key features, and product details match your needs.



How to interpret portable SSD speed tests
Speed tests describe specific parts of portable SSD behaviour only when the reported result is read with its test conditions. A benchmark score can compare the measured workload, but it does not predict every transfer type or operating state. Do not interpret a single score as the complete performance result.
These variables define the interpretation limit of the result.
First identify whether the test reports a read metric, a write metric, or both, because each measures a different data direction. Then inspect the queue and file pattern, including whether the workload is sequential, random, large-file, small-file, or mixed. Review the test duration, capacity state, and connection path, because a short test on an empty drive through a direct connection represents different conditions from a long test on a fuller drive through an adapter or hub. These variables define the interpretation limit of the result.
- Metric: Check whether the result measures reading, writing, or both; a read result does not establish sustained write behaviour.
- Queue: Check how many operations are active at once; a deeper queue represents heavier parallel activity, while a shallow queue is closer to many ordinary single-user transfers.
- File pattern: Check whether the test uses sequential, random, large-file, small-file, or mixed data; compare results only when the patterns are equivalent.
- Test duration: Check whether the run measures an initial burst or continues long enough to show sustained behaviour; a short run has a narrower interpretation limit for long copies.
- Capacity state: Check whether the portable SSD is empty, partly filled, or close to full; results from different capacity states are not directly equivalent.
- Connection path: Check the host port, cable, adapter, hub, and interface mode; the slowest active part of that path limits the measured result.
Compare advertised claims with independent tests only when the interface, workload, metric, and test condition are identified. Then match those conditions to realistic workloads; for example, a long large-file copy is better represented by a sustained sequential write test than by a brief peak read result. A useful decision signal is agreement across multiple comparable tests that resemble the expected files, transfer length, capacity state, and connection path. When the conditions do not match, treat the result as evidence for that specific test rather than as a universal performance value.
Compare advertised claims with independent tests only when the interface, workload, metric, and test condition are identified.
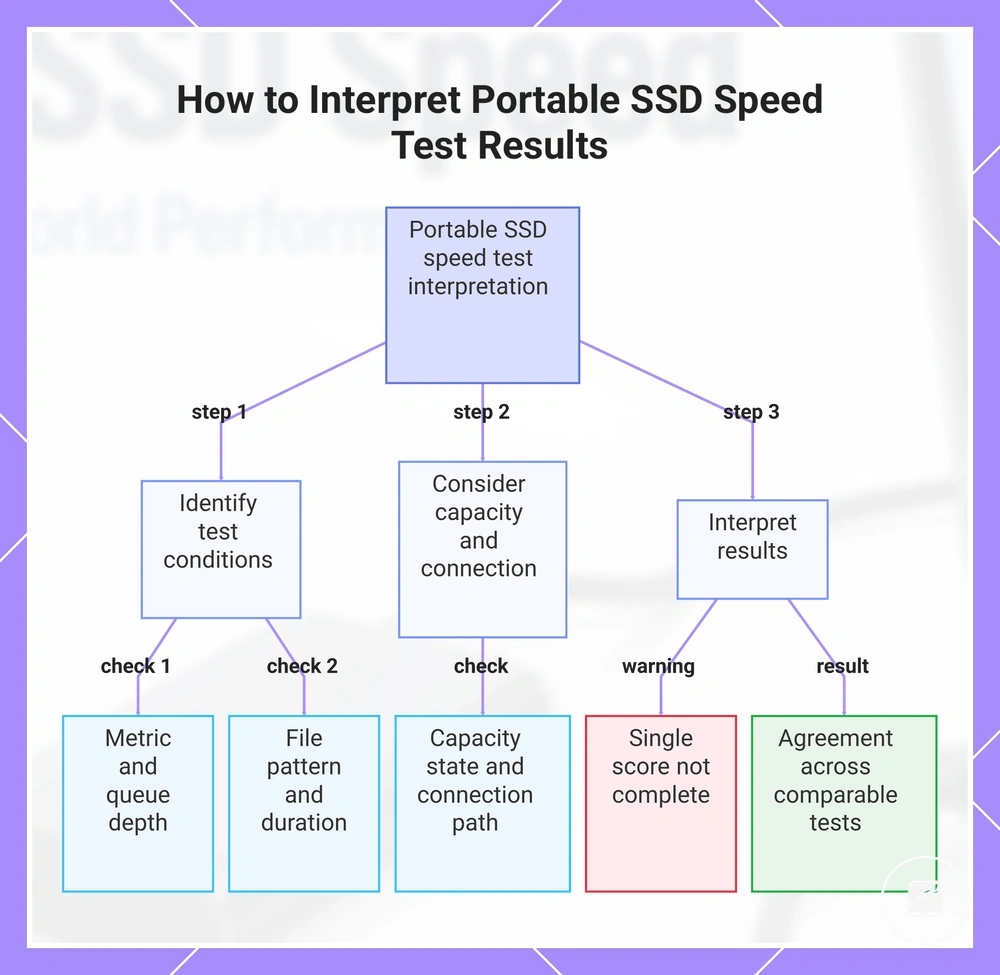
This chart outlines the key steps to interpret portable SSD speed test results by identifying test conditions and applying interpretation rules.
Benchmark results and advertised speed claims
Benchmark results and advertised speed claims should be compared only when they describe equivalent test conditions. Manufacturer speed claims commonly represent performance measured in a defined test environment, while independent benchmarks reflect their own benchmark conditions. Claims and benchmarks need matching conditions before they can support the same interpretation.
Claims and benchmarks need matching conditions before they can support the same interpretation.
Compare the connection standard, read direction or write direction, and whether the result represents a burst workload or a sustained workload. A higher claimed speed and a lower tested speed do not automatically conflict when they were measured under different conditions. For example, an advertised maximum read value should not be compared directly with a sustained write benchmark collected through a different interface. The expected interpretation should come from matching conditions rather than from an isolated maximum number.
| Claim or result | Condition to check | Why it matters |
|---|---|---|
| Advertised maximum | Test environment and connection standard | The claim applies to the stated measurement conditions rather than to every workload. |
| Benchmark read result | Read direction and benchmark condition | The result should be compared with other read tests collected under equivalent conditions. |
| Benchmark write result | Write direction and workload type | The result describes write behaviour and should not be treated as equivalent to a read result. |
| Sustained result | Burst workload versus sustained workload | A sustained result represents extended transfer behaviour, while a burst result represents short-duration peak performance. |