
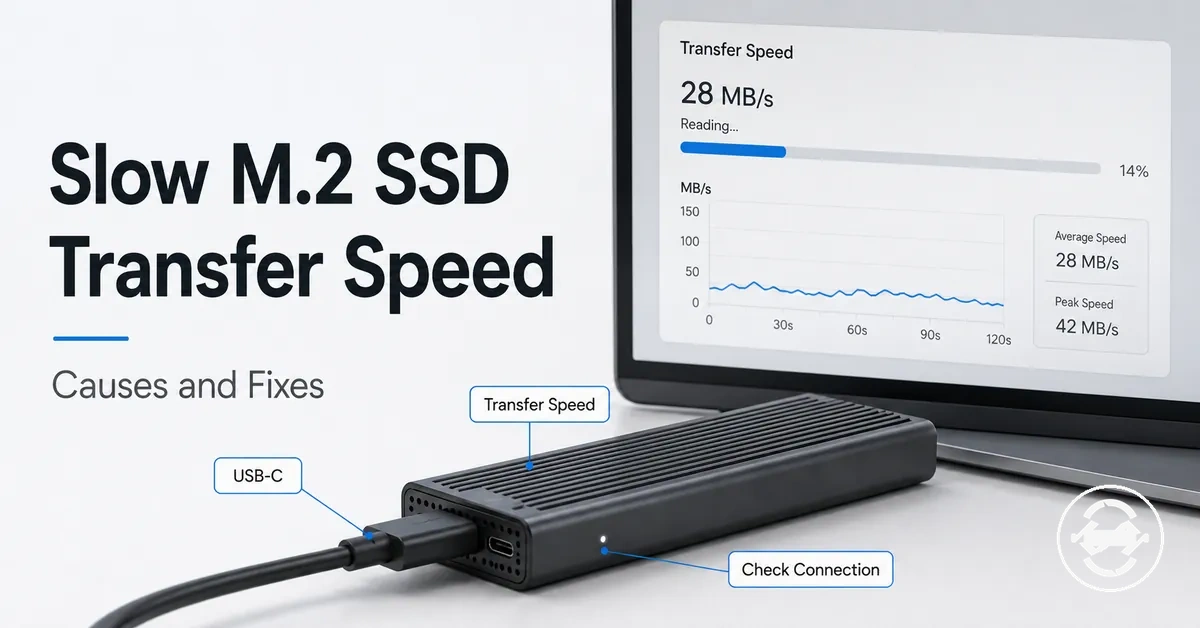
M.2 SSD Enclosure Slow Transfer Speed
When an M.2 SSD enclosure has slow transfer speed, the likely limit is usually the weakest part of the USB port, cable, enclosure class, SSD, heat, or workload chain. The same symptom can come from a lower negotiated link speed, a limited cable, SSD write behavior, thermal throttling, or the type of files being copied, so the cause should be verified before replacing parts.
Start by keeping the M.2 SSD enclosure and SSD constant, then test the connection path one variable at a time. A different USB port, a suitable cable, a direct connection instead of a hub, and a repeated benchmark can help separate a port or cable limit from an enclosure class, heat, or workload limit.
A useful diagnosis compares the visible symptom with the condition that triggers it. If speed is capped from the start, the connection path may be limiting the enclosure; if speed starts fast and drops later, the cause may be SSD write behavior, thermal throttling, or a sustained workload. Treat the result as a clue, then isolate each cause before assuming the external SSD enclosure is faulty.
Expected External M.2 Enclosure Speeds Before Troubleshooting
Expected external M.2 enclosure speed depends on the slowest compatible link in the connection chain. The expected speed is determined by the combined limits of the interface class, host port, cable rating, SSD protocol, workload, and connection overhead. Advertised bandwidth describes interface capability, but it should not be treated as guaranteed real transfer speed.
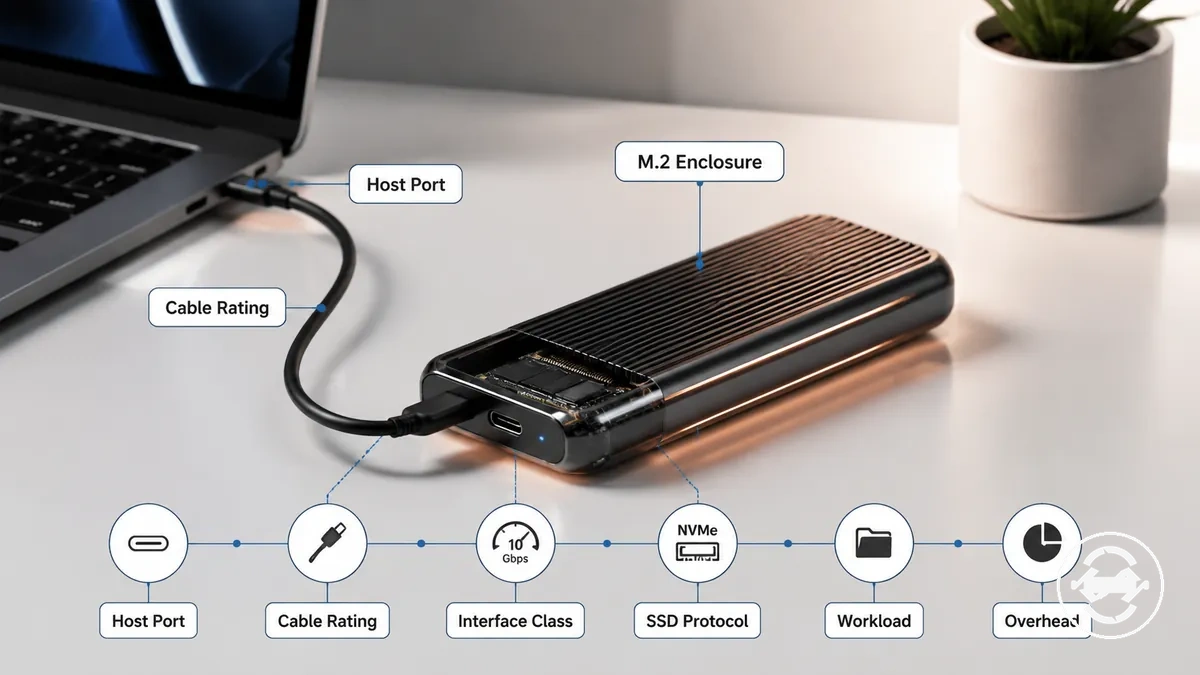
The diagram clarifies how each connection component contributes to the final transfer result. It also helps explain why a normal result may appear slower than the interface label when overhead or backward compatibility affects the connection. Use the comparison below as a diagnostic baseline before investigating a slow speed symptom.
| Item or condition | What to check | What it can mean |
|---|---|---|
| Interface class | Compare the enclosure class with the host port capability | A lower interface class can limit expected speed. |
| Cable rating | Verify the cable supports the intended connection | An unsuitable cable may reduce real transfer speed. |
| SSD protocol | Confirm the SSD protocol matches the enclosure design | A protocol mismatch can affect expected performance. |
| Workload type | Compare benchmark results with sustained file transfers | Different workloads can produce different transfer rates. |
| Overhead | Allow for protocol and connection overhead | Real transfer speed is often lower than advertised bandwidth. |
Use these conditions to decide whether the observed performance is within a normal range before starting deeper troubleshooting. If the connection chain appears appropriate but performance still seems unusually low, additional diagnosis may be needed. For broader background on typical performance differences, see real speed expectations.
Slow Transfer Symptoms and Likely Cause Patterns
Different slow transfer speed patterns usually point to different limits rather than one universal fault. A visible symptom can help narrow the likely cause, but each pattern should be verified before drawing a conclusion because a cable, port, heat, SSD behavior, or workload can produce similar results.
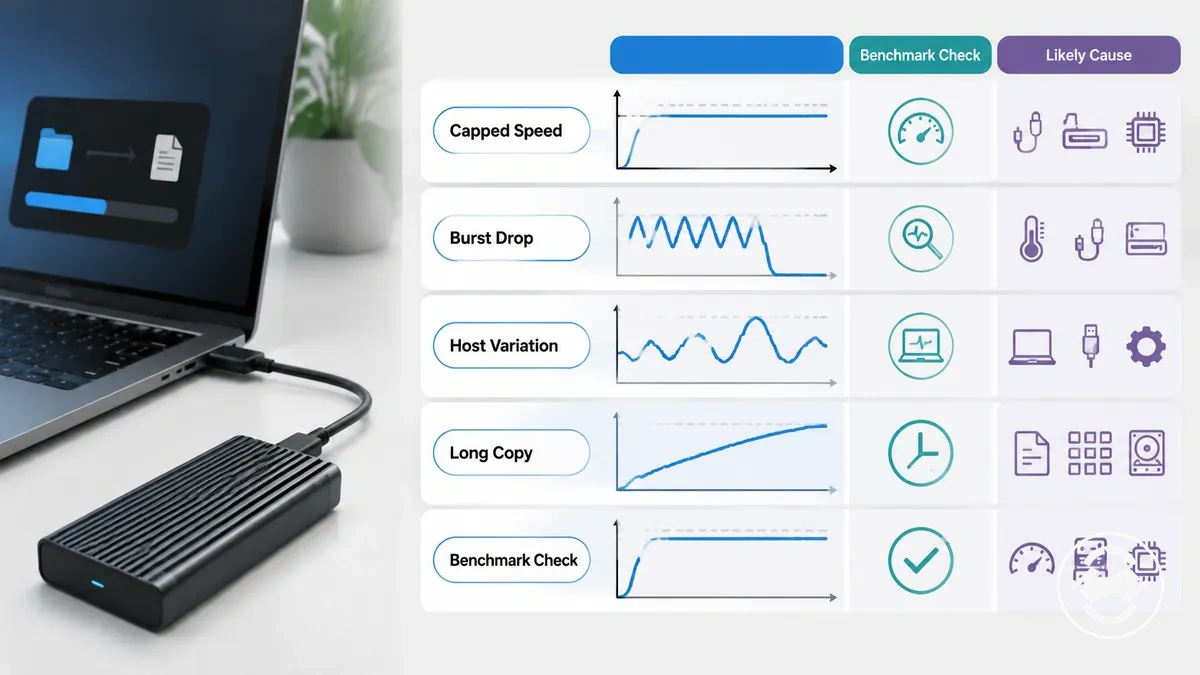
The checklist below groups common transfer behaviors by symptom, verification step, and likely cause family. Use it to separate connection-related limits from heat, cache, and workload effects before applying changes.
- Capped speed: Check whether the transfer repeatedly reaches the same limit across different tests. Likely implication: A cable, port, or enclosure connection may be limiting link performance.
- Burst drop: Check whether transfer speed starts high and then falls during sustained copying. Likely implication: Heat, SSD cache behavior, or workload may be reducing sustained performance.
- Device-specific variation: Compare results on another compatible computer or USB port. Likely implication: The original host or connection path may be introducing the limitation.
- Long-copy slowdown: Repeat the test with files of different sizes and transfer durations. Likely implication: Sustained workload or thermal conditions may differ from short transfers.
- Inconsistent benchmark results: Repeat the same benchmark under similar conditions. Likely implication: Background activity, workload changes, or connection differences may be affecting the measurement.
Match the visible symptom to its likely cause family before replacing hardware or changing settings. A symptom is a diagnostic signal rather than proof of a single cause, so targeted verification provides a more reliable basis for troubleshooting.
Speed Capped Near USB 2.0 or 5Gbps Levels
When transfer speed is capped near USB 2.0 or 5Gbps levels, the symptom often indicates that the M.2 enclosure is negotiating a lower link speed than expected. The cause is commonly related to the connection path rather than the enclosure itself, so check the host port, cable, adapter, hub, and reported link speed before assuming the enclosure is defective.
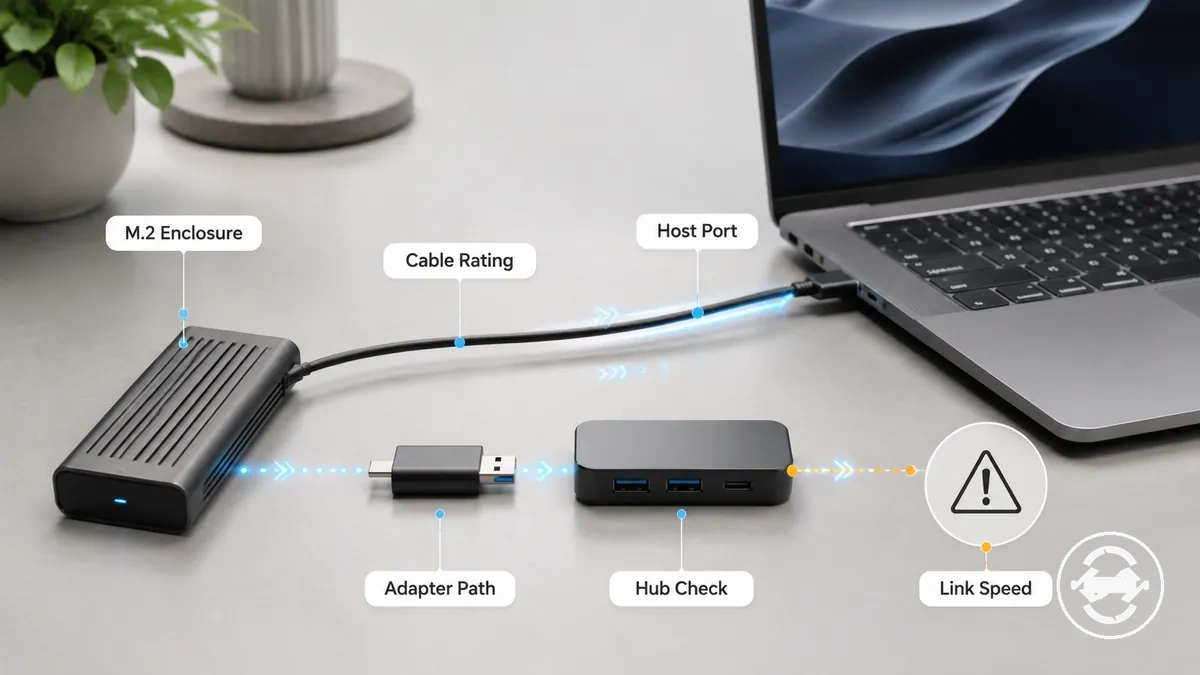
The checklist below helps identify whether the capped speed is caused by link negotiation or another bottleneck. USB-C connector shape and USB generation are different attributes, so matching connector types do not necessarily indicate the same link speed. After completing these checks, review ports and cable limits if the symptom remains unresolved.
- Host port: Check that the enclosure is connected to the intended USB generation. Likely implication: A lower-speed port may negotiate a lower link speed.
- Cable rating: Verify that the cable supports the required data connection. Likely implication: A lower-rated cable can become the bottleneck.
- Adapter or hub: Test the enclosure with a direct connection instead of a hub, dock, or adapter. Likely implication: An intermediate device may reduce available throughput.
- Operating system: Check the reported USB link speed or connection information. Likely implication: The reported link speed can help confirm lower-speed negotiation.
- Enclosure connection: Reseat the enclosure and repeat the transfer test. Likely implication: An incomplete connection may contribute to inconsistent or capped speed.
Fast Burst Followed by a Large Speed Drop
When a transfer starts very fast and then slows significantly, the symptom often indicates a difference between initial burst performance and sustained write performance. The cause may be SSD cache behavior, heat, the destination drive, or the workload rather than the M.2 enclosure itself, so the slowdown should be verified before assuming a hardware fault.
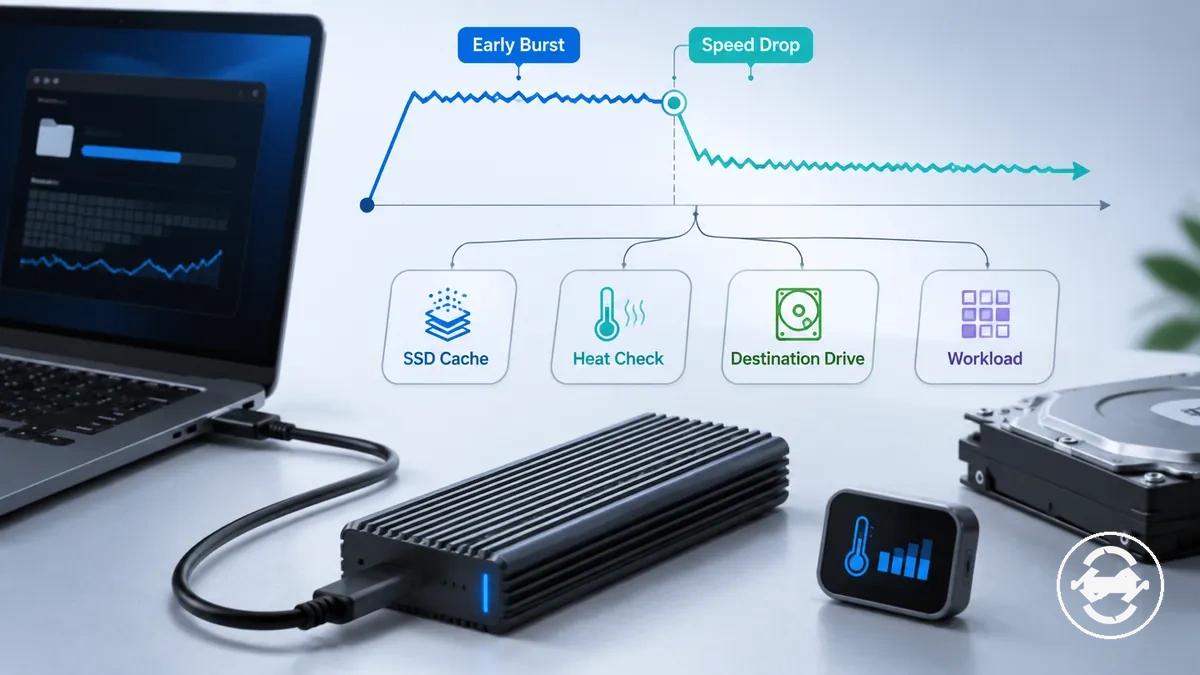
The comparison below separates early burst speed from sustained transfer speed. A burst drop can occur without overheating, so compare cache behavior, enclosure temperature, SSD controller behavior, destination-device speed, and workload before identifying the most likely cause.
| Early Burst | Sustained Transfer |
|---|---|
| High initial write speed at the beginning of a large copy. | Lower transfer speed during longer writes as conditions change. |
| May reflect temporary SSD cache performance. | May reflect cache exhaustion, SSD controller behavior, destination-drive limits, or sustained workload. |
| Usually appears during the first stage of the transfer. | Check enclosure temperature together with benchmark results to determine whether heat is contributing before assigning a single cause. |
Slow on One Computer but Normal on Another
When an M.2 enclosure is slow on one computer but performs normally on another, the symptom usually indicates that the host system or connection path is the more likely cause. The difference may involve the USB controller, port, cable, operating system behavior, power mode, destination storage, or workload, so compare both computers using the same enclosure, SSD, cable, file set, and benchmark before assuming a hardware fault.
Keep the enclosure, SSD, and cable unchanged while changing only the host computer or port path. The checklist below helps isolate the variable that changes between the two systems and identifies the next verification point.
- Host USB controller: Compare the same transfer on both computers. Likely implication: Different controller behavior may influence transfer performance.
- Port generation and path: Test another USB port and avoid front-panel ports, adapters, or docks when comparing systems. Likely implication: The original port path may be limiting throughput.
- Operating system and power mode: Repeat the test under similar system conditions. Likely implication: Driver behavior or power management may affect sustained performance.
- Destination storage: Copy the same files to a comparable destination drive on each computer. Likely implication: The receiving drive may become the bottleneck during the workload.
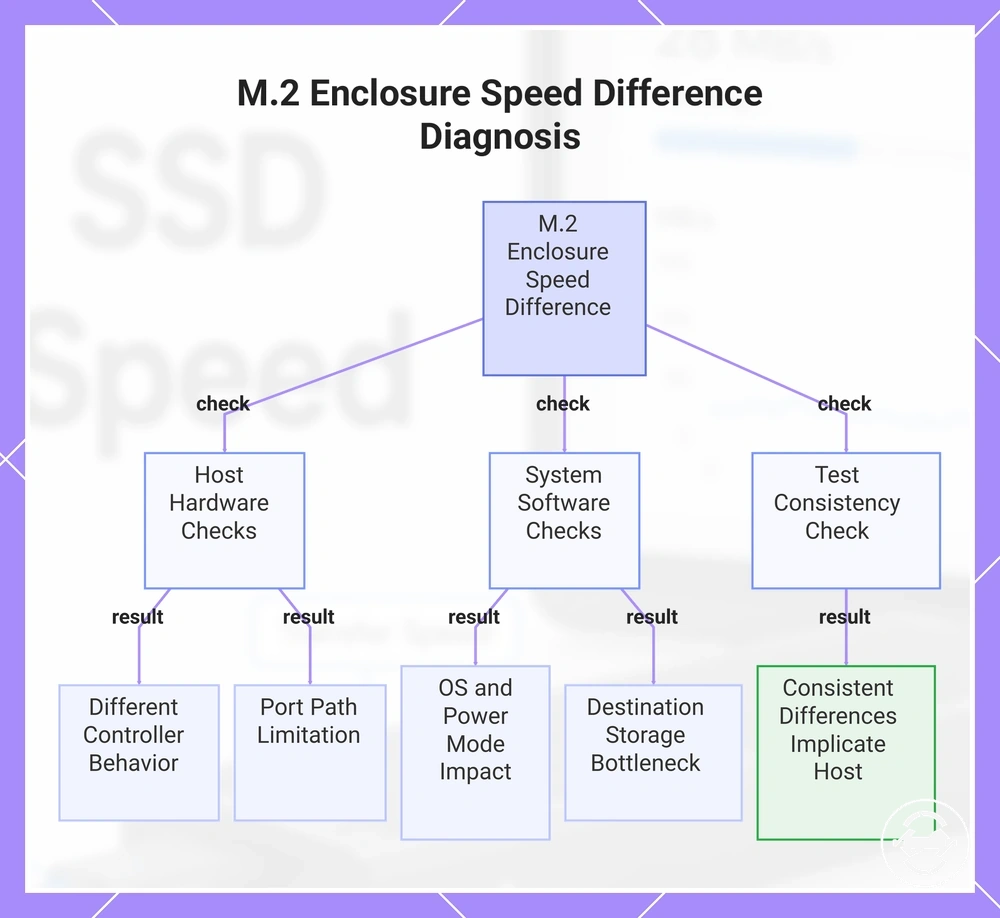
- Benchmark consistency: Run the same benchmark with identical settings on both systems. Likely implication: Consistent differences strengthen the case that the host computer, rather than the M.2 enclosure, is responsible for the slow speed.
This chart shows the key variables to compare when an M.2 enclosure performs slowly on one computer but normally on another, helping isolate host-related causes.
Interface Limits That Reduce Enclosure Speed
Interface limits can reduce enclosure speed when the weakest compatible connection determines the effective transfer rate. Even if an M.2 enclosure supports a higher interface class, the USB generation, cable rating, host port, adapter, hub, dock, bridge chipset, or UASP support may limit link speed and real throughput.
Check the connection chain before assuming the enclosure or SSD is responsible for slow transfers. The table below organizes interface-related items by the condition to verify and the effect they may have on transfer performance.
| Item or condition | What to check | What it can mean |
|---|---|---|
| USB generation | Compare enclosure support with the host port capability | A lower supported generation may reduce link speed. |
| Cable rating | Verify the cable supports the intended data connection | An unsuitable cable can become the throughput bottleneck. |
| Adapter, hub, or dock | Repeat the test with a direct connection | An intermediate device may limit available throughput. |
| Bridge chipset | Confirm the enclosure bridge supports the intended connection path | Bridge behavior may influence real throughput. |
| UASP support | Check whether the operating system is using UASP | A different USB storage mode may reduce transfer efficiency. |
| Advertised bandwidth | Compare interface capability with observed throughput | Real throughput may be lower because of protocol overhead and negotiated link speed. |
Use these checks to identify which interface component deserves testing first instead of replacing hardware prematurely. If the bottleneck appears to follow a specific connection path, review ports and cable limits for more detailed interface-specific guidance.
USB Port, Cable, and Adapter Link Speed
USB port, cable, and adapter link speed can limit transfer performance even when the M.2 enclosure and SSD support higher throughput. Check the connection path in order because the effective link speed depends on the weakest compatible component. USB-C connector shape does not by itself indicate USB generation or throughput, so verify the connection class before identifying the likely bottleneck.
Keep the enclosure, SSD, workload, and benchmark unchanged while checking each connection component in sequence. The checklist below helps isolate which part of the path may be limiting performance.
- Host port: Confirm the USB generation used for the connection while keeping the same enclosure and SSD. Likely implication: A lower-capability port may reduce link speed and throughput.
- Cable rating: Replace only the cable with one that supports the intended data connection. Likely implication: A lower-rated cable can become the bottleneck even if the connectors fit.
- Adapter: Remove or replace the adapter while keeping the remaining connection unchanged. Likely implication: The adapter may limit available throughput.
- Hub or dock: Connect the enclosure directly to the host port instead of through a hub or dock. Likely implication: An intermediate device may restrict link speed.
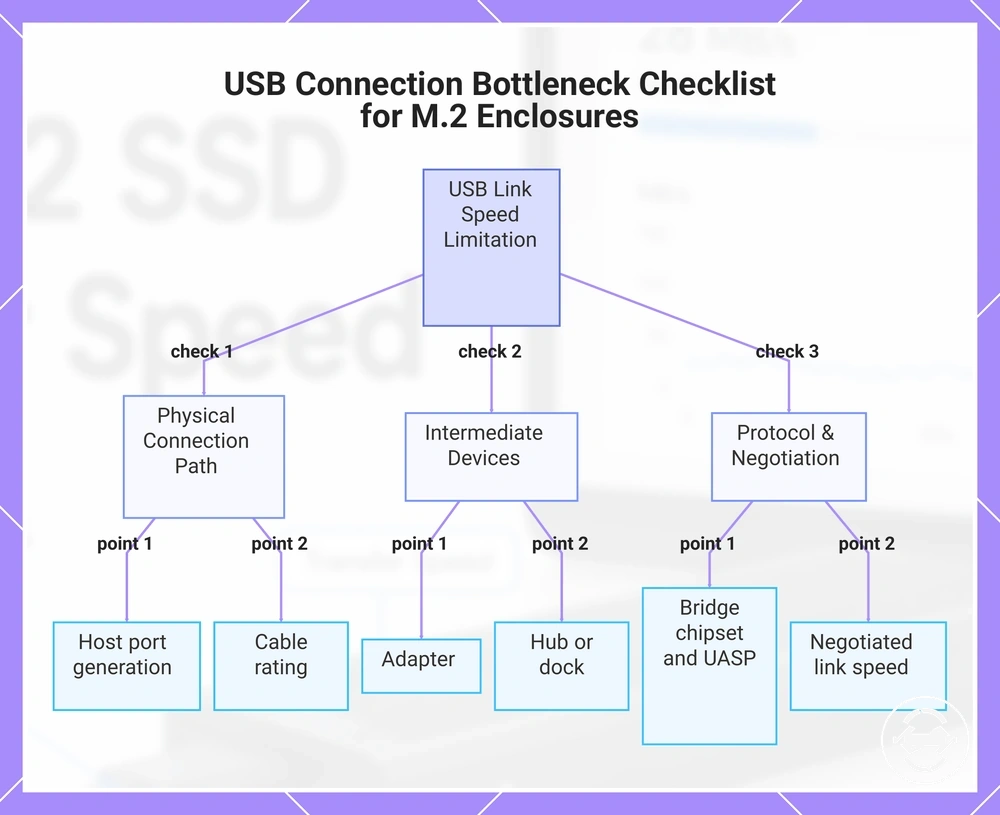
- Connection support: Verify bridge chipset behavior, UASP support, and the negotiated connection without changing the SSD or enclosure. Likely implication: Differences in connection support may explain lower real throughput even when advertised bandwidth appears higher.
This chart lists the main checkpoints to isolate the component that limits USB transfer speed with an M.2 enclosure and SSD.
10Gbps, 20Gbps, and Thunderbolt Enclosure Limits
10Gbps, 20Gbps, and Thunderbolt enclosure classes define different interface ceilings, but actual transfer speed depends on matching host support throughout the connection path. A higher-rated M.2 enclosure may still operate at a lower link speed if the USB generation, cable rating, adapter, bridge chipset, UASP support, or host connection cannot support the same class. Backward compatibility usually allows the connection to function, but throughput is typically limited by the slowest compatible interface.
The comparison below organizes enclosure classes by the support they require and the limitations that may affect real throughput.
| Enclosure class | Required support and likely limitation |
|---|---|
| 10Gbps | Requires a compatible USB generation, suitable cable rating, and host port. Throughput may be limited if another connection component supports a lower class. |
| 20Gbps | Requires matching host support, cable rating, and connection path. A lower-capability adapter, hub, dock, or host port may reduce negotiated link speed. |
| Thunderbolt-class | Requires compatible host support and an appropriate connection path. Protocol mismatch or backward compatibility may allow operation while limiting real throughput to the supported interface. |
Keep the enclosure, SSD, workload, and benchmark unchanged while comparing different host ports or connection paths. If performance changes only when the host, cable, or protocol path changes, the interface chain is more likely to be limiting throughput than the enclosure itself.
Bridge Chipset and UASP Support
Bridge chipset and UASP support can influence transfer speed because the bridge chipset translates the SSD connection into the external USB storage path. If the enclosure, operating system driver, firmware, or storage transport falls back to a less efficient mode, real throughput may be lower even when the port and cable appear suitable.
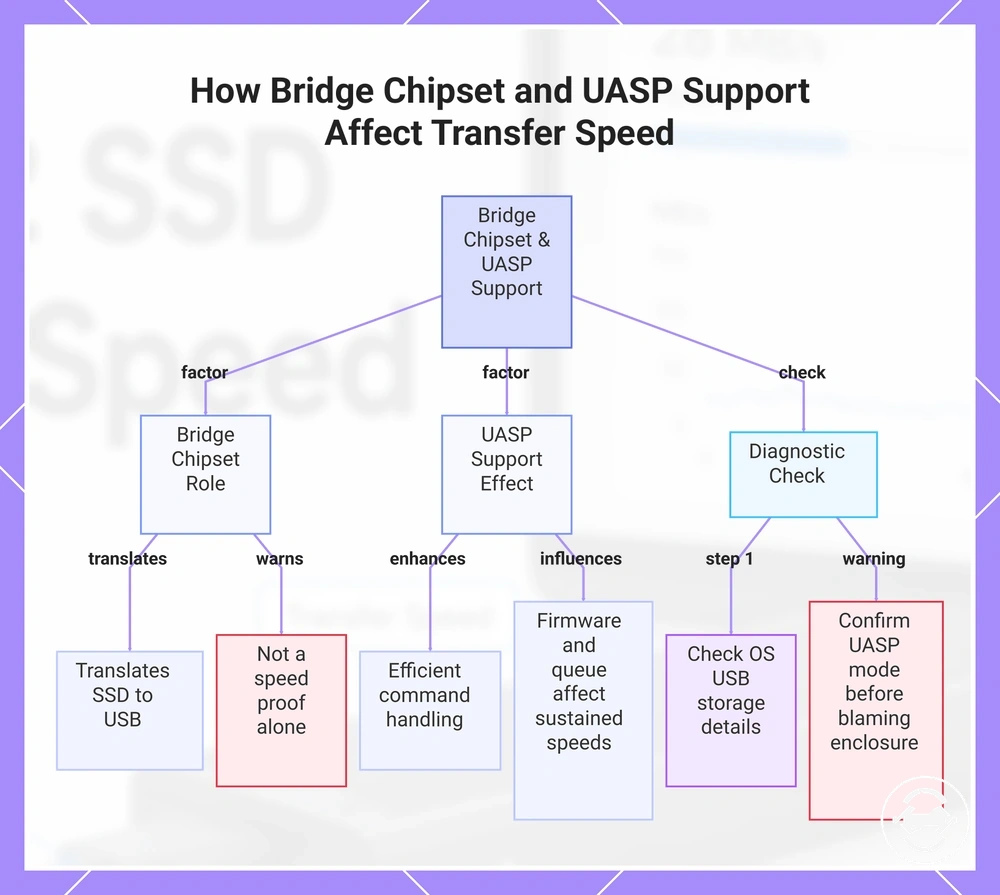
The bridge chipset should be treated as a compatibility attribute, not as proof that one enclosure is faster without model-specific evidence. UASP support can help the system handle storage commands more efficiently when the enclosure and driver use the same storage transport, while firmware stability and command queue behavior may affect sustained transfers. Diagnostic note: Check the operating system’s USB storage details to see whether UASP or a fallback mode is being used before assigning the cause to the enclosure.
This chart shows how bridge chipset and UASP support influence transfer speed, including key factors and a diagnostic check to avoid misattributing slowdowns.
Drive and Transfer Conditions That Slow External SSD Copies
Slow external SSD copies can happen even when the enclosure link speed is correct. If there is no obvious capped speed from the cable or port, the symptom may come from the SSD, destination drive, file workload, cache behavior, filesystem overhead, antivirus scanning, system load, or heat.
Shift from interface checks to transfer-condition checks after excluding a clear connection cap. The table below maps common copy-speed symptoms to the condition to verify and the likely cause family.
| Item or condition | What to check | What it can mean |
|---|---|---|
| Source SSD cache | Compare a short copy with a longer sustained write | A burst drop may point to cache behavior or sustained write limits. |
| Destination drive | Copy the same file set to another destination | The receiving drive may be limiting copy speed. |
| File size and workload | Test one large file and then many small files | Many-small-file workloads may slow copying because of filesystem and metadata overhead. |
| Filesystem overhead | Compare similar transfers on the same filesystem setup | File handling overhead may affect real copy speed even when benchmark results look normal. |
| Antivirus scanning | Repeat the transfer under similar conditions while checking security activity | Scanning or background checks may reduce copy speed during active transfers. |
| System load | Check background tasks during the transfer | CPU, memory, or disk activity may compete with the workload. |
Use another file set, another destination, or a benchmark when the symptom changes with workload rather than with the enclosure connection. If the same cable, port, and enclosure behave normally under a benchmark but slow down during real copies, the workload or destination is more likely involved. For practical usage patterns, review file transfer workflow tips.
SLC Cache Exhaustion During Large Writes
When a transfer begins quickly and then shows a burst drop during a long copy, the symptom may be caused by SLC cache exhaustion rather than by the M.2 enclosure. This write behavior can appear even when the cable, port, and enclosure link are working correctly. The cause is usually related to sustained writes instead of a capped speed from the connection path.
For example, a large file may copy at a high rate until the SSD cache is filled, after which sustained speed can decrease. The effect may vary with write size, available free space, SSD cache behavior, drive temperature, destination drive performance, and overall workload. Background tasks or antivirus scanning may also influence copy speed during long transfers. Retest with a smaller file set or compare sustained write behavior to help determine whether the slowdown comes from SSD write behavior rather than the enclosure.
File Size, Destination Drive, and System Load
File size, destination drive speed, and system load can reduce observed transfer speed without changing the external SSD enclosure’s maximum capability. Even when USB generation, cable rating, adapter path, bridge chipset, UASP support, link speed, and throughput are suitable, the workload can still make copy speed look slow. Treat operating-system copy speed as a symptom to compare, not as the only proof of enclosure performance.
The checklist below separates workload factors from hardware link limits while keeping the enclosure, cable, port, and benchmark conditions consistent.
- Large files versus many small files: Compare one large file with a folder of many small files. Likely implication: File size and filesystem overhead may change the observed copy speed.
- Destination drive: Copy the same workload to another destination drive. Likely implication: A slower destination may limit transfer performance.
- Antivirus scanning: Repeat the transfer while checking for active security scanning. Likely implication: Scanning may reduce copy speed during the workload.
- Background tasks: Test again when the computer is idle. Likely implication: Active CPU, memory, or disk activity may compete with the transfer.
- Power settings: Compare the same transfer under a higher-performance power mode when available. Likely implication: Power behavior may affect sustained speed on some systems.
Heat-Related Speed Drops in M.2 Enclosures
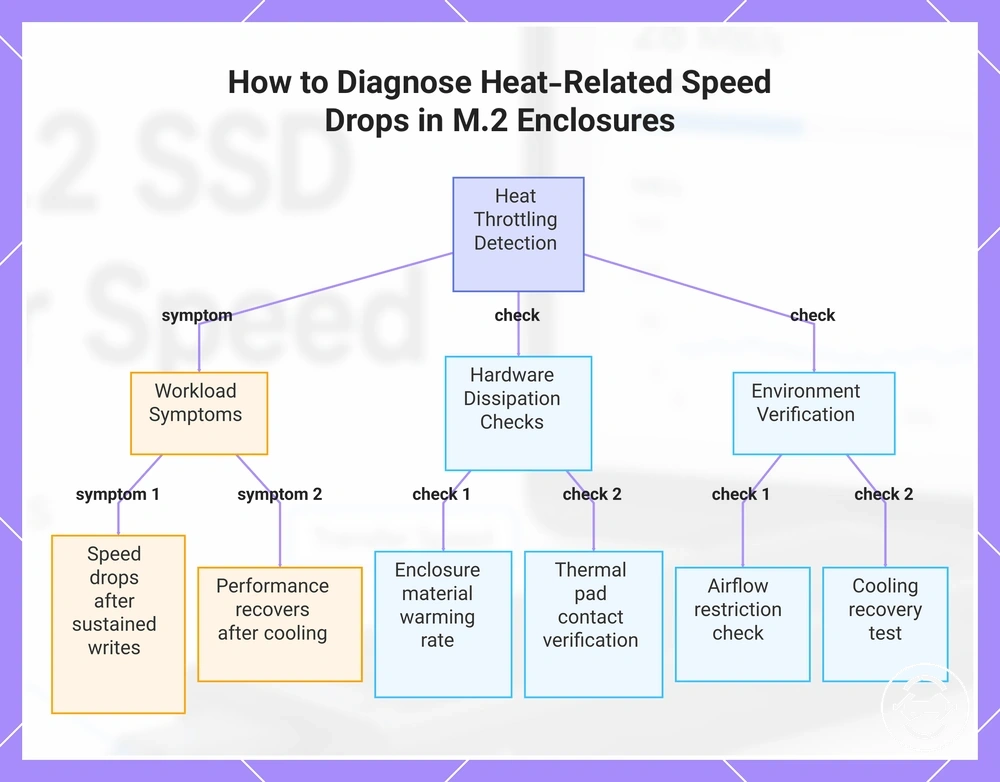
Heat can reduce transfer speed when the SSD controller or M.2 enclosure cannot dissipate sustained load quickly enough. The symptom is more likely heat-related when speed drops after sustained writes, the enclosure becomes very warm, and performance partly recovers after cooling. Warm enclosure surfaces can be normal, so heat should be treated as a likely cause only when timing and recovery behavior match the slowdown.
The checklist below organizes heat clues by timing, touch temperature, workload, and recovery behavior. Use it to separate a temperature-related burst drop from a capped speed caused by the cable or port.
- Sustained writes: Check whether speed drops only after a longer workload. Likely implication: Heat may be building during continuous activity.
- Enclosure material: Compare how quickly the enclosure warms and releases heat. Likely implication: The enclosure body may affect heat dissipation.
- Thermal pad contact: Check whether the SSD controller appears to contact the thermal pad correctly. Likely implication: Poor contact may reduce heat transfer from the controller.
- Airflow: Repeat the transfer with better surrounding airflow. Likely implication: Restricted airflow may contribute to sustained temperature buildup.
- Cooling recovery: Pause the transfer, let the enclosure cool, and test again. Likely implication: Repeated recovery after cooling strengthens the heat-related throttling signal.
If the enclosure is only warm but speed remains stable, the issue may be temperature comfort rather than transfer performance. If heat signs consistently align with transfer slowdowns, review heat and throttling for deeper temperature-focused troubleshooting.
This chart shows the key symptoms and checks to identify heat throttling in M.2 enclosures, helping distinguish it from other speed limitations.
Fixes for Slow M.2 SSD Enclosure Transfers
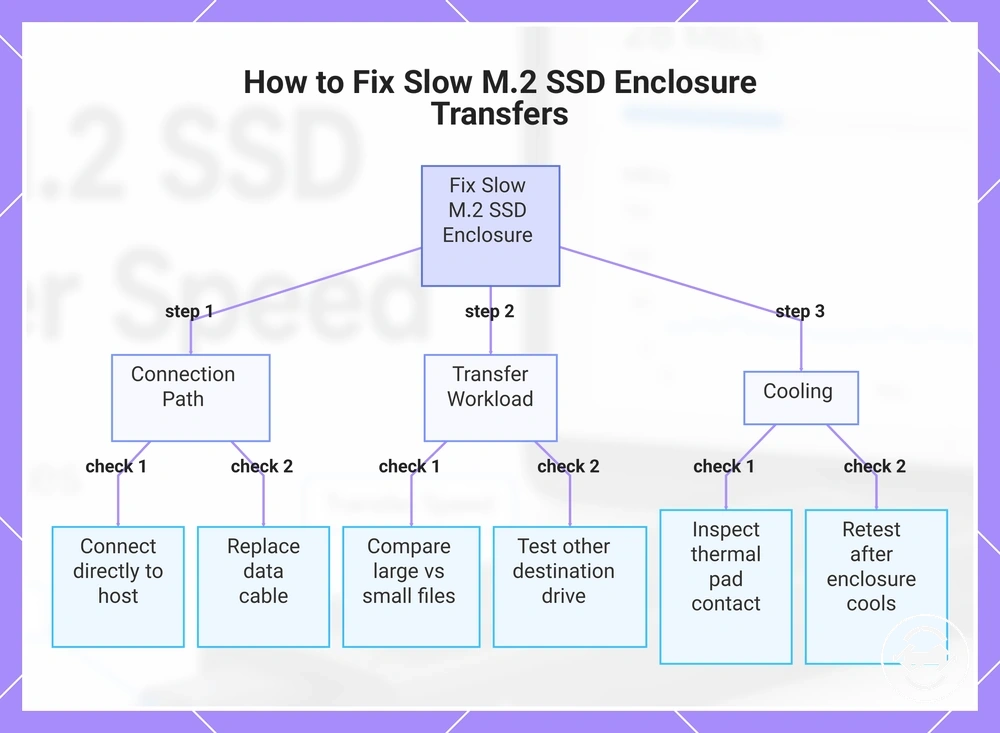
The safest fix sequence is to test the connection path, verify link speed, control the transfer workload, and then improve cooling if the slowdown appears during long transfers. Change one variable at a time so each result can identify a likely cause before moving to the next step. Avoid replacing the M.2 enclosure before the cable, port, benchmark, workload, and cooling conditions have been checked.
The ordered steps below keep variables controlled so each fix can be judged clearly. Use the outcome of each step to decide whether the next action should focus on the connection path, the workload, or heat.
- Change the connection path: Connect the enclosure directly to a host port without a hub or dock, then retest the same file set. Interpretation: If transfer speed improves, the previous connection path was likely contributing to the symptom.
- Change the cable: Test with a known-rated data cable while keeping the same port, enclosure, SSD, and workload. Interpretation: If performance improves, the original cable may have been limiting the connection.
- Run the same benchmark: Use the same benchmark before and after each change. Interpretation: Consistent benchmark results help separate connection issues from operating-system copy behavior.
- Test another computer: Keep the enclosure, SSD, cable, and benchmark unchanged while changing only the host computer. Interpretation: If results differ, the host system or port is more likely involved.
- Compare workloads: Test one large file, many small files, and the same transfer to another destination drive. Interpretation: If only certain workloads are slow, the workload or destination is more likely than the enclosure.
- Check cooling: Inspect thermal pad contact, improve airflow, and retest after the enclosure cools. Interpretation: If speed drops during sustained transfers and partly recovers after cooling, heat may be contributing.
- Retest after each change: Repeat the same transfer or benchmark before making another adjustment. Interpretation: Isolating one variable at a time provides clearer verification than making multiple changes together.
If direct connection or cable changes improve the result, continue with connection-related checks. If benchmark results remain stable but real file copies slow down, focus on workload and destination conditions. If the slowdown consistently appears during sustained activity and improves after cooling, prioritize thermal checks before considering hardware replacement.
This chart shows the systematic steps to diagnose and fix slow M.2 SSD enclosure transfers by testing the connection path, workload, and cooling conditions.
Test With a Known Fast Cable and Port
Test with a known fast cable and port by keeping the M.2 enclosure and SSD unchanged while changing only the connection path. This approach helps determine whether the cable, port, adapter, hub, or dock is limiting link speed before treating the enclosure as the likely cause. Use the same benchmark or workload and retest after each single change so the result can be attributed to one variable.
The steps below keep the test controlled while changing only the cable, port, or adapter path.
- Change the host port: Connect the enclosure directly to a laptop port or rear motherboard port. Interpretation: If transfer speed improves, the previous port path may have been the bottleneck.
- Remove the adapter, hub, or dock: Retest using a direct connection instead of an intermediate device. Interpretation: If performance improves, the removed connection path may have been limiting real throughput.
- Change the cable: Use a known-rated data cable while keeping the same enclosure, SSD, port, benchmark, and workload. Interpretation: If the result changes, cable rating may be affecting link speed.
- Retest the same file set: Repeat the identical transfer after each single change. Interpretation: Consistent conditions make it easier to identify which variable caused the difference.
- Repeat the benchmark: Run the same benchmark immediately after each test. Interpretation: Similar benchmark results suggest continuing with workload or cooling checks, while improved results point back to the connection path.
Verify Link Speed and Benchmark Conditions
Verify link speed and benchmark conditions before deciding that the M.2 enclosure is causing slow transfers. First confirm the reported USB link speed or negotiated connection class, then verify that the benchmark and workload are using consistent test conditions. Treat a single benchmark result as a diagnostic clue until it matches real file transfer behavior.
The checklist below separates link-speed verification from workload verification so each result can be interpreted more reliably.
- Reported link speed: Check the negotiated USB connection reported by the operating system. Likely implication: A lower link speed may indicate a limitation in the port, cable, adapter, hub, or dock.
- Test file size: Use the same test file size for every benchmark or repeat test. Likely implication: Changing the test file can change the workload and affect comparison.
- Basic test conditions: Keep the same port, cable, enclosure, SSD, and power mode during each benchmark. Likely implication: Stable conditions make verification more reliable.
- Destination drive: Test with the same destination drive or compare with another suitable drive. Likely implication: A slower destination drive may influence observed transfer speed.
- Background load: Repeat the benchmark while background tasks are minimal. Likely implication: Active system load can reduce benchmark consistency.
- Repeat test consistency: Run the same benchmark more than once using identical settings. Likely implication: Consistent results provide stronger verification than one isolated benchmark score.
Improve Thermal Contact During Long Transfers
When transfer speed drops after the M.2 enclosure becomes warm during a sustained transfer, improving thermal contact may help reduce heat-related slowdowns. Apply thermal maintenance only after the slowdown pattern points to sustained-load heating rather than a cable, port, benchmark, or workload issue. Disconnect power before opening the enclosure and avoid incompatible materials or adjustments while it is powered.
The checks below focus on safe maintenance practices. Retest the same sustained transfer after each thermal adjustment so the result can be linked to that single change.
- Thermal pad placement: Check that the thermal pad is positioned correctly over the SSD controller area. Likely implication: Poor placement may reduce heat transfer during sustained writes.
- Contact surface: Confirm that the SSD, thermal pad, and enclosure contact surface align correctly when the enclosure is closed. Likely implication: Better contact may improve heat dissipation.
- Airflow: Place the enclosure where airflow is unobstructed. Likely implication: Improved airflow may reduce heat buildup during a sustained transfer.
- Flat placement: Keep the enclosure flat on a stable surface while transferring data. Likely implication: Stable placement may help maintain consistent thermal contact.
- Transfer batching: Divide long transfer sessions into smaller batches when repeated heat-related slowdown occurs. Likely implication: Shorter workloads may reduce controller temperature and recovery delays.
- Cooling time: Allow adequate cooling time before repeating the same sustained workload. Likely implication: If performance improves after cooling, heat is more likely contributing to the slowdown.
When a Faster Enclosure, Cable, or Port Is the Real Fix
A faster enclosure, cable, or host port is the right upgrade only when testing shows the current hardware cannot support the speed class your SSD and workload require. Replace the limiting part only after controlled testing identifies a genuine hardware or interface ceiling. If the slowdown is caused by workload, heat, or system conditions instead, upgrading the connection path may provide little benefit.
The comparison below separates upgrade targets by the limiting part, the required condition, and the expected benefit. Use it after confirming that the slowdown is not caused by an inconsistent benchmark or transfer workload.
| Upgrade target | Required condition and expected benefit |
|---|---|
| Cable | If the cable cannot support the required speed class, replacing it may remove the connection bottleneck when host compatibility and the enclosure also match. |
| Host port | If the computer connection supports a lower interface than the enclosure, using a compatible host port may allow higher throughput. |
| Faster enclosure | If moving from a 10Gbps class to a 20Gbps class, the SSD, host support, cable rating, compatibility, and sustained workload should also be able to benefit. |
| Thermal design | If speed falls only during a sustained workload because of heat, improving thermal design may reduce heat-related slowdowns rather than increase interface speed. |
| SSD capability | If the SSD cannot benefit from a higher speed class, replacing the enclosure alone may result in limited improvement. |
Use these decision signals before replacing hardware. Reviewing real speed expectations can help confirm whether the identified bottleneck matches the improvement you expect from the upgrade.
Upgrade only the component that testing identifies as the limiting part instead of replacing multiple parts at once. If you need broader compatibility and selection guidance after confirming a genuine interface ceiling, continue with the M.2 SSD enclosure guide.
Slow Transfer Speed Versus Detection and Disconnecting Issues
Slow transfer speed should be diagnosed separately from detection failure or repeated disconnects because the symptom, cause, and verification path are different. A slow but working M.2 enclosure remains visible to the operating system and can complete a copy or benchmark, even if the speed is lower than expected. If the drive disappears, transfers stop, or connection stability changes when the cable or port moves, the issue is no longer only a slow-speed problem.
The comparison below separates symptoms by what still works, what fails, and which troubleshooting path fits. Use it as a boundary check before applying speed-focused fixes.
| Issue type | What still works and what fails |
|---|---|
| Slow transfer speed | The drive stays visible, the connection remains stable, and the copy or benchmark completes, but the result may show capped speed, burst drop, heat-related slowdown, or workload limits. |
| Detection failure | The operating system may not show the enclosure or SSD, so troubleshooting should focus on detection, port recognition, cable connection, enclosure seating, and system visibility. |
| Repeated disconnects | The drive may appear and disappear, transfers may be interrupted, or the symptom may change when the cable, port, or enclosure is moved. |
| Power or stability behavior | The enclosure may behave unreliably under load, which can require checking power behavior and connection stability before interpreting transfer speed. |
Keep this page focused on slow speed when the external SSD enclosure remains detected and transfers can finish. If the drive is not detected or repeatedly disconnects, treat that as a separate reliability issue before comparing benchmark, heat, or workload results.